Educator Onboarding
LEO Art Challenge Workshop
Satellite Tracking, Orbits, and Modeling
Workshop: Satellite Tracking, Orbits, and Modeling
Workshop: Trek-a-Sat
Workshop: Yerkes
Workshop: Electrostatics in Space - Carthage- Yerkes
Workshop: Life in Space! BTCI
Workshop: More Than a Rainbow - Yerkes
Workshop: Small Steps Teachimg Space Brings Giant Steps in Classrooms-SEEC
Workshop: 2017-01-28 Yerkes
Tools You Might Use
Educational Learning
Standards
Documentation
An explanation of aerodynamic lift
Тематический план
-
Author: Peter Higgins, PhD Updated August 2023
Keywords: aerodynamics, lift, wake turbulence, Bernoulli, flow equations, openFOAM, XFoil, JavaFoil
Intended for students 14+
Prerequisites: some basic science, but there are few equations here, whats really needed is curiosity and an interest in airplanes.
Lift is explained as resulting from circulation, and is not the consequence of the widely held but the erroneous equal transit time hypothesis. Both wind tunnel observations and the author's own wing modeling in OpenFoam are used to explain what really happens. It is seen that the vortices that are a danger to following aircraft taking off behind jumbo-jets are also explained as a necessary result of lift generation. This lecture puts the Bernoulli equation in lift generation in proper perspective. The presence of lift in other atmospheres, such as found on Mars, is discussed.
This lesson is intended for high school and lower university levels. It introduces students to the excellent book on the subject by Clancy. Hopefully, some will be inspired to learn computer modeling by looking at the results presented.
Aerodynamic lift refers to the force pushing upwards that is generated on an airplane wing when it moves through the atmosphere. In short, lift keeps the airplane flying, without lift planes can not fly even with powerful engines. Rockets can, but that is another story.
Lift can be understood by wind tunnel observations. When a wing is angled into the flow slightly upward, the flow is always faster flow over the top than under it. According to the principle of conservation of energy, such faster flow lowers the top surface pressure forcing (or sucking) the wing up. This principle was discovered by Daniel Bernoulli and will be discussed later.
A question remains, however, why is the top flow faster when lift occurs? A common reason presented for this phenomenon is that the path over the top surface is longer than the path along the bottom surface so that flow over the top speeds up to join its counterpart at the trailing edge. This is wrong because as observed in wind tunnels, when flow recombines the top flow does not meet its counterpart that split at the front. The real reason is described in this lesson.
Anticipating that some students will want to learn more about the performance of wings, known as airfoils, this lesson identifies three programs available for free that can be run by high school students to quantify lift for different airfoils. Airfoil shapes for different airplanes, like the Boeing 747, can be downloaded from the Internet. Analyzing wing performance could be a great Senior project.
Lastly, since this lecture has been done with space exploration in mind, the lift of NASA's Martian helicopter is studied. It is noteworthy that it actually flew successfully because the Martian atmosphere is so thin compared to the Earth's. You can run the programs discussed in this lesson to see for yourself.
-
The video clip below is an animation from openFlow of a NACA airfoil in Earth's atmosphere for very small timesteps showing the development of low pressure (blue) along the top of the wing in just a fraction of a second (each timestep is a tenth of a second). The black lines are contours of pressure change. When the spacing between contours is small, the change is greater. (called a gradient) This animation shows that the low pressure that develops dominates, and lift occurs.Just four equations describe the variation of pressure, density, temperature and velocity in a fluid flow such as in the track of hurricanes, or around wings in flight. The process of solving these equations in a flowing fluid is called numerical analysis, and is done in time steps. The results presented in the next slides come from OpenFoam. After several hours of computer time to simulate a few minutes of actual flow across the wing, results for the problem variables such as pressure and velocity can be visualized by graphics software.Click on the graphic above to see the development of lift as seen by low pressure (blue) being established on the top of the airfoil while high pressure occurs on the bottom. Once the equations are solved for an airfoil moving through the fluid (Earth's atmosphere) with enough angle of attack for lift, pictures of the final pressure and velocity can be examined. These are shown next:
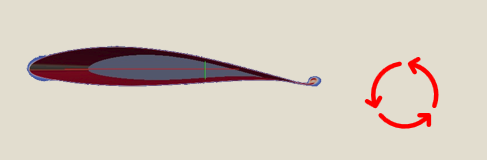
Modeled pressure
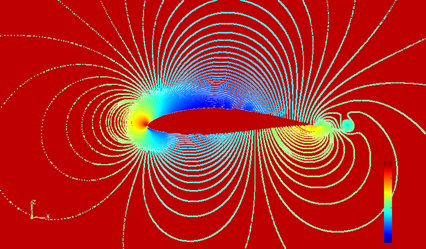 High pressure is red-yellow, low pressure appears blue.
The modeled pressure in the flow around the airfoil section shows high pressure at the leading edge of the airfoil, and at the underside of the trailing edge. Importantly, it also shows low pressure along the top of the wing where the flow is faster. So, low pressure on the top of the wing shows up from solving the equations, nothing was input into the model to force this result. Why is this?
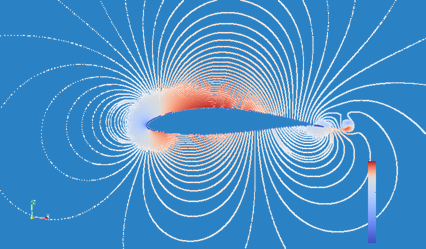
The companion graphic for velocity reveals a higher velocity on the top of the wing as expected. It is this resolution of the numeric model, which correspond to wind tunnel observations that establish that modeling is useful.
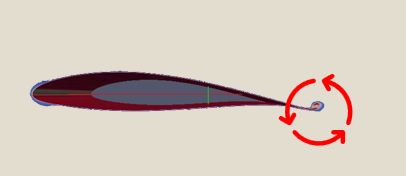
The model resolves an important feature that the arrow points to in the figure below called a trailing (starter) vortex. It is this vortex that explains faster flow on the top surface of the wing. How it does this is described next.

Here is what the computer model tells us
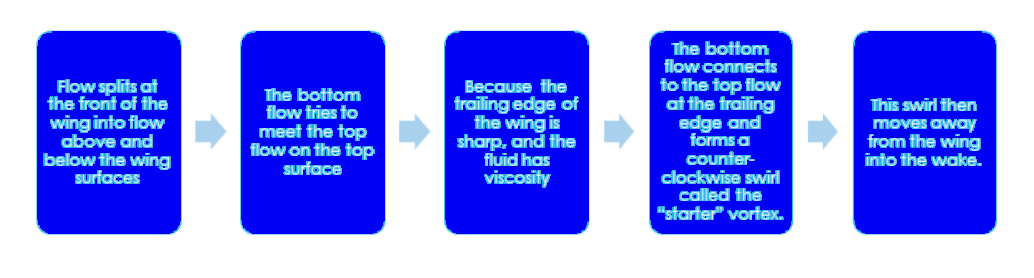
Flow splits at the front of the wing into flow above and below the wing surfaces, the bottom flow tries to meet the top flow by flowing back around the sharp edge of the airfoil which would establish a second stagnation point on the top surface near the back edge. But due to real fluid properties, such as viscosity, it cannot flow back around the tailing edge even though it retains a counter-clockwise tendency. Instead, it connects to the top flow at the trailing edge forming a counter-clockwise swirl called the “starter” vortex which we see in the computer model. This vortex is predicted by aerodynamic theory as covered in the Clancy text. Once formed this vortex moves into the wake.
The starting vortex that moves into the flow stream behind the wing is well known as wing tip vortices that present a hazard to closely following aircraft at airports. In the 1970’s I was funded by NOAA to design an acoustic doppler transmitter, receiver warning device for installation on the main runway at Denver’s Stapleton airport. This device would detect the presence of the remains of the starter vortices by a reflected acoustical pulse.
Wikipedia states “The origin of counter-rotating wing tip vortices is a direct and automatic consequence of the generation of lift by a wing”.
A known consequence of the shedding vortex
 See the blurred image at the trailing edge of this planes wing - this is a visualization of the generation of lift.